Creating equal-area grids
A while ago I published a bubble-grid map of the European continent showing absolute population change over a regular grid. But I made a rookie mistake: I’ve accidentally created a grid where the grid cells have different areas, thereby compromising the bubble grid map which is supposed to show counts over equal areas. This mistake happened because I created the grid over geographic data in spherical coordinates (latitude-longitude data). What I should have done (and correctly did in a subsequent blog post) is to project the geodata to equal-area coordinates before applying a grid. Here’s a demonstration of the wrong and the correct approach…
library(eurostat)  # eurostat data
library(tidyverse) # tidy data transformation
library(sf)        # simple features GIS

# download geospatial data for NUTS-3 regions
eu_nuts3_sf <-
  get_eurostat_geospatial(output_class = 'sf',
                          resolution = '60', nuts_level = 3)

# divide the European continent into a 150 by 150 cell grid
# using a spherical CRS
euro_grid_the_wrong_way <-
  st_make_grid(eu_nuts3_sf %>% filter(LEVL_CODE == 3) %>% st_transform(4258), n = 150)

# Here's a demonstration how the area of the grid-cells depend
# on their latitude:
euro_grid_the_wrong_way %>%
  st_coordinates() %>%
    as_tibble() %>%
    slice(seq(1, n(), 5)) %>%
    mutate(area = as.numeric(st_area(euro_grid_the_wrong_way))) %>%
    ggplot(aes(y = area, x = Y)) +
    geom_point() +
    labs(x = 'latitude',
         title = 'Area of grid cells as a function of latitude',
         subtitle = 'Using a spherical projection as basis for the grid')
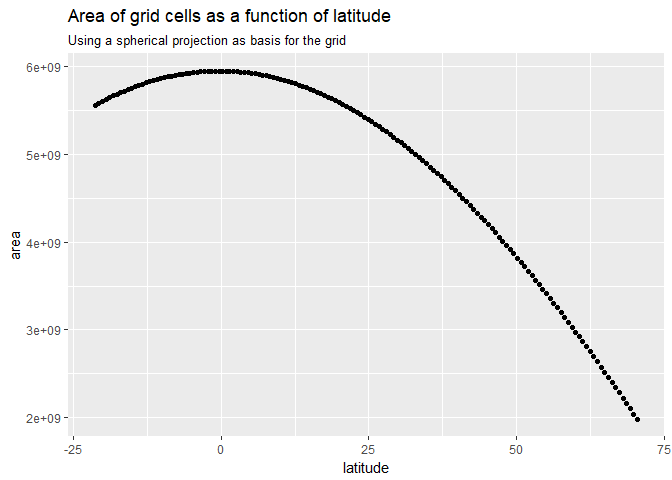
This is what you get when applying a regular grid to a sphere: The areas will depend on latitude.
Here’s how to create an equal-area grid.
# divide the European continent into a 150 by 150 cell grid
# use an equal area projection
euro_grid_equal_area <-
  eu_nuts3_sf %>% filter(LEVL_CODE == 3) %>% st_transform(3035) %>%
  st_make_grid(n = 150)

# all grid-cell areas are equal
euro_grid_equal_area %>%
  st_coordinates() %>%
  as_tibble() %>%
  slice(seq(1, n(), 5)) %>%
  mutate(area = as.numeric(st_area(euro_grid_equal_area))) %>%
  ggplot(aes(y = area, x = Y)) +
  geom_point() +
  labs(x = 'latitude', title = 'Area of grid cells as a function of latitude',
       subtitle = 'Using an equal-area projection as basis for the grid.')
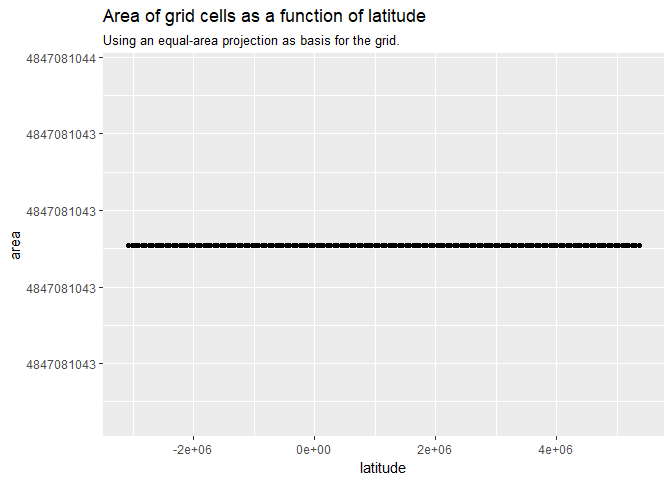
Applying a regular grid to an equal area projection will ensure that the grid-cells will have equal areas.