-
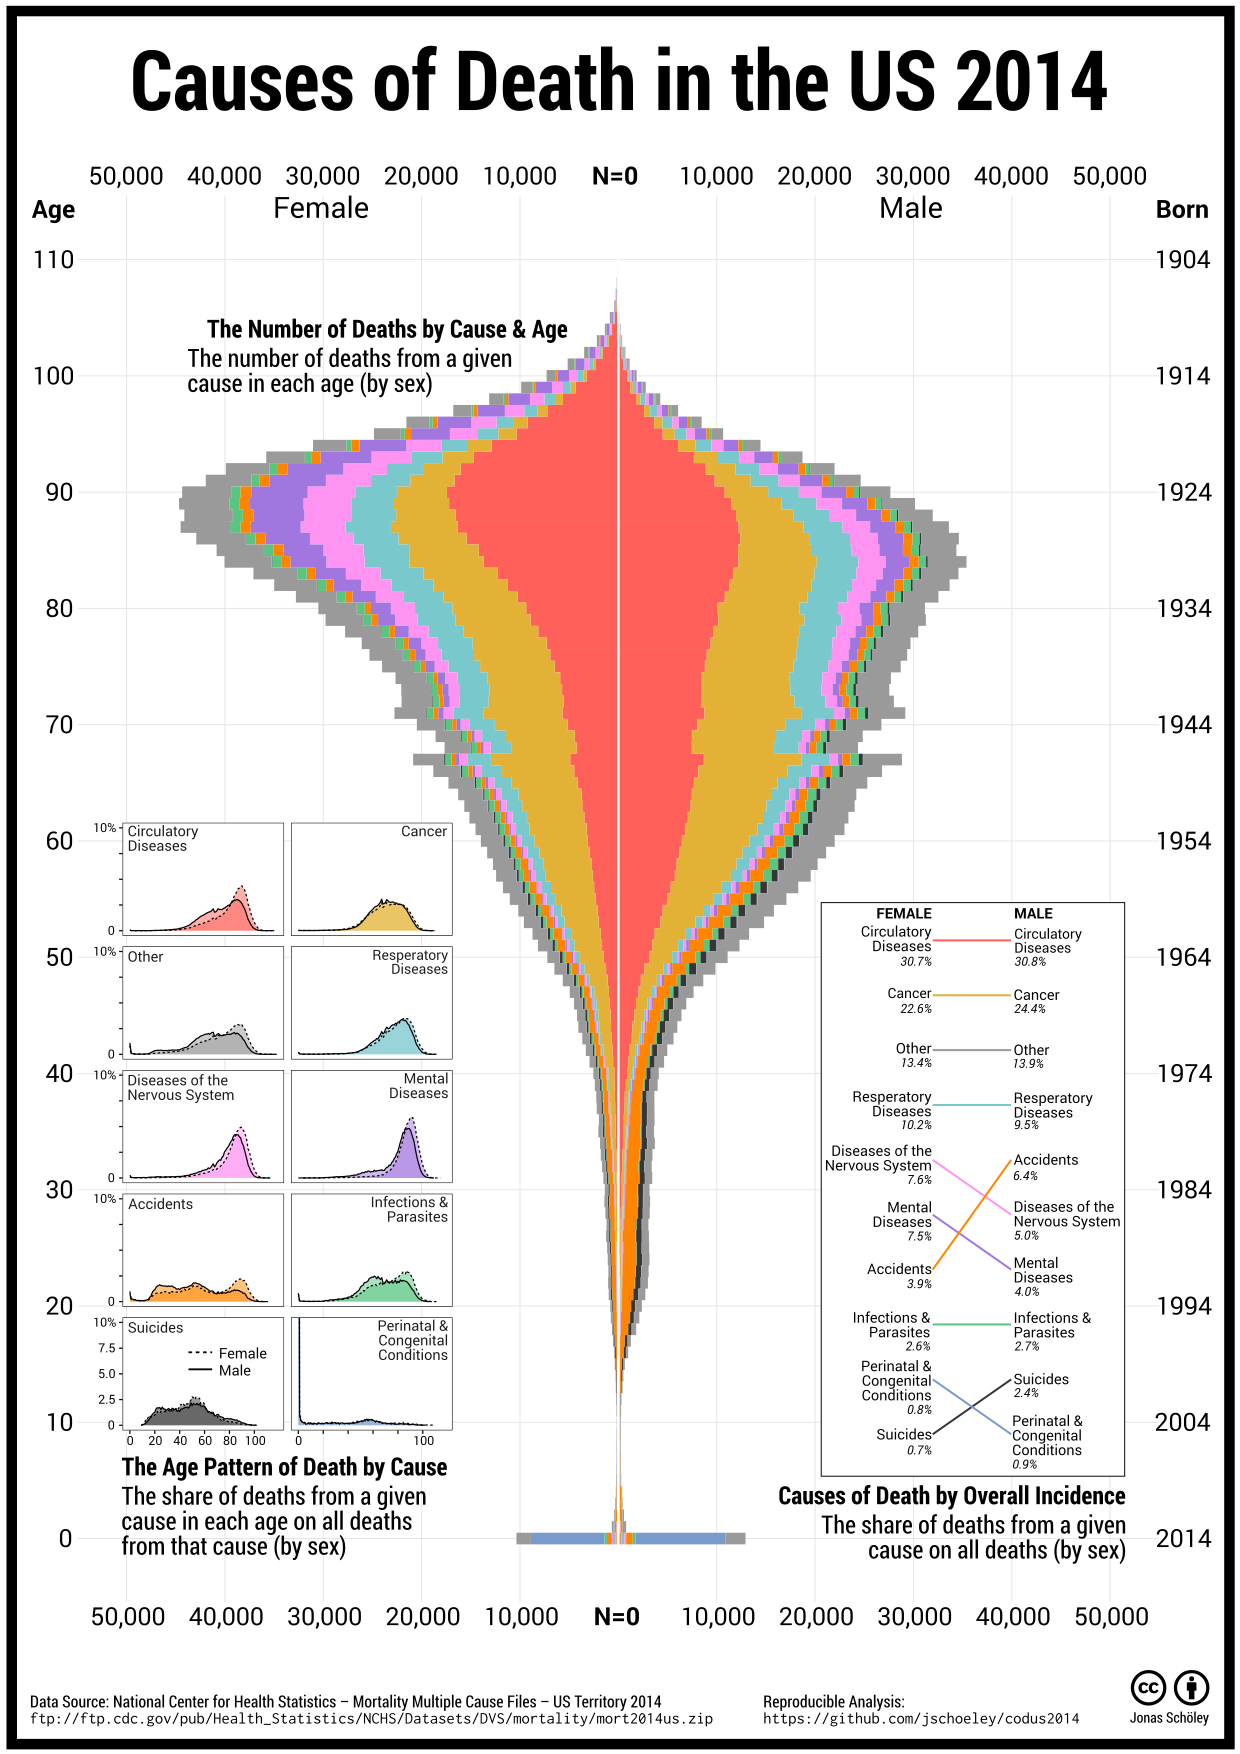
My Reply to flowingdata's Causes of Death Chart
 My Reply to flowingdata’s Causes of Death Chart
 -
How I Started Learning Data Visualization
To learn the craft of data visualization one has to know where to start. The following list is comprised of items which helped me in gaining some skills, namely:
- Advanced knowledge of the visualization library
ggplot2, - best practices on visualizing data, and
- an overview of data visualization as a scientific field.
- Advanced knowledge of the visualization library
-
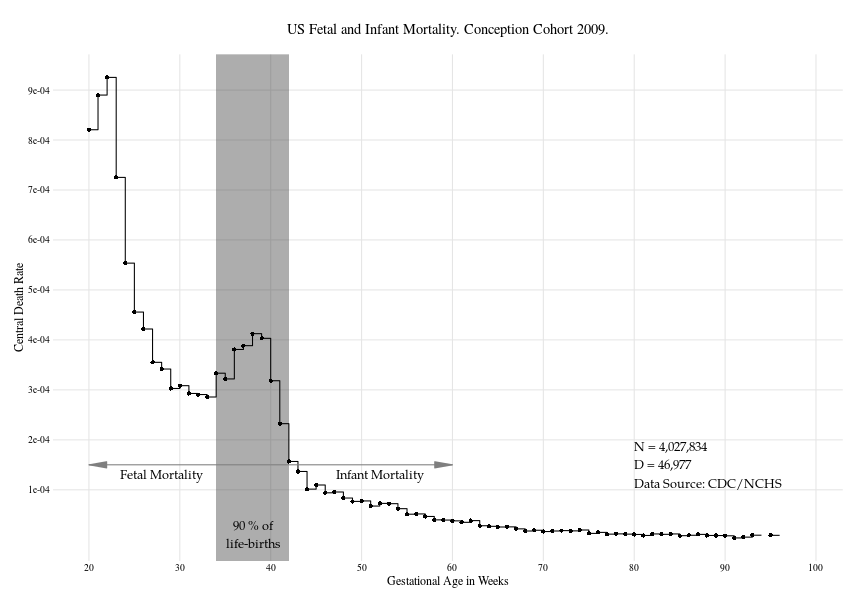
The Age Pattern of Human Fetal- and Infant Mortality
 Mortality Rates over Gestational Age for the US 2009 Conception Cohort
 -
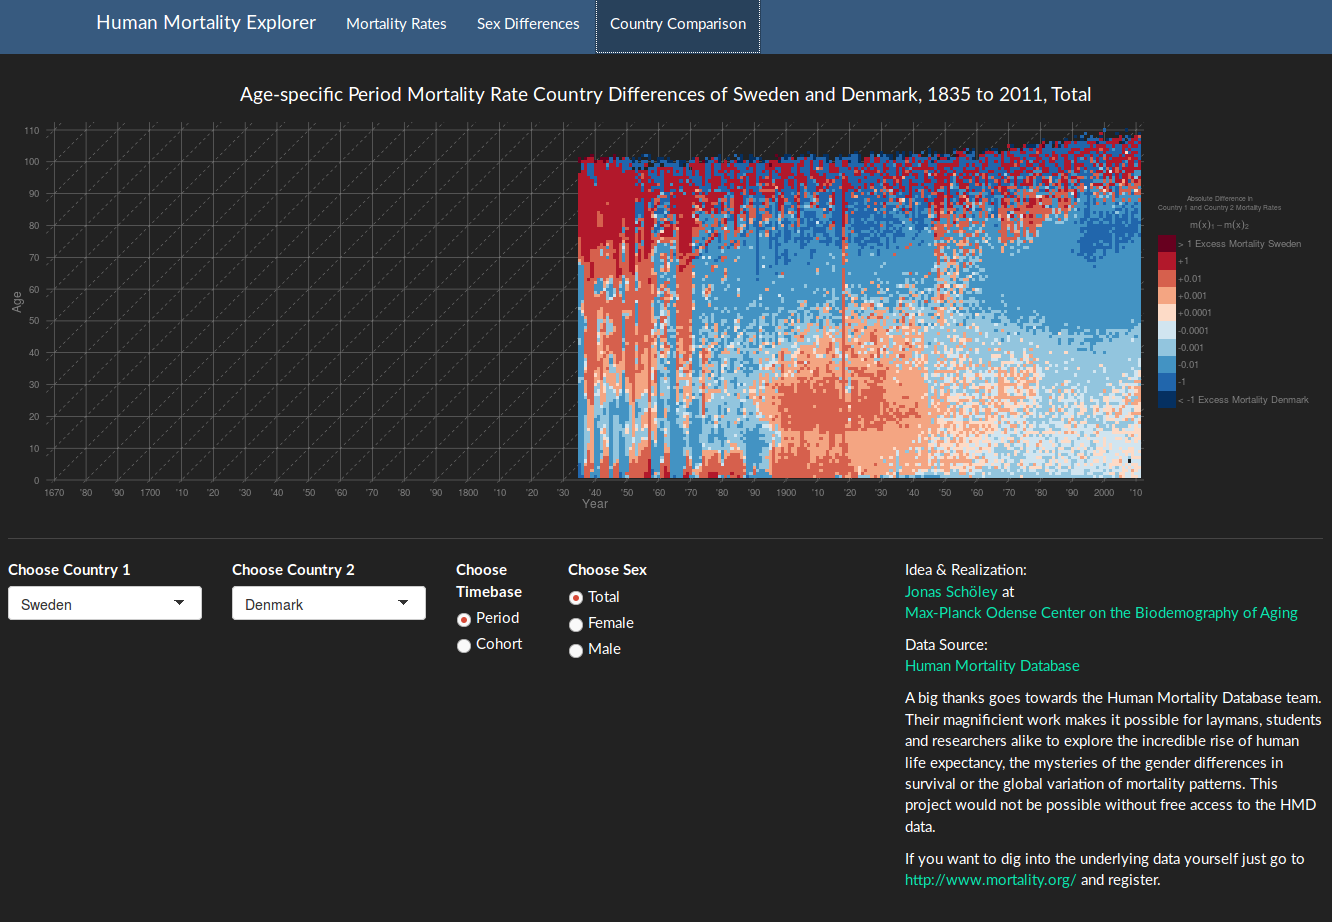
The Human Mortality Explorer
 https://jschoeley.shinyapps.io/hmdexp
 -
Greatest Beer Selection
 As Seen in a Supermarket in Odense, Denmark