The Age Pattern of Human Fetal- and Infant Mortality
 Mortality Rates over Gestational Age for the US 2009 Conception Cohort
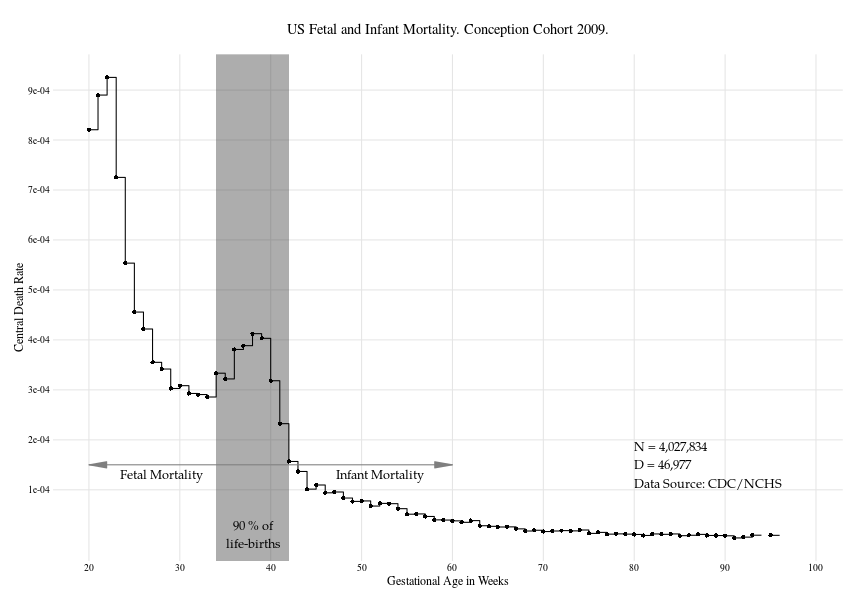
Using US microdata on fetal- and infant mortality I constructed a cohort of individuals who where conceived in the year 2009. I then constructed a life-table for this population with gestational age (time since last menses of the mother) in weeks as time dimension. This approach allows for an integrated view on fetal- and infant mortality age patterns.
The above plot shows the mortality rates of the US 2009 Conception Cohort over gestational age, starting with week 20. The same sharp decline in mortality rates which is known to happen over the days, weeks and months after birth is visible prior to birth, only on a higher level. Around gestational week 33–40 we can see a “birth hump”. Birth itself is a risky event for the unborn child and momentarily increases the chance of dying.
See here for the full analysis.
cc-by Jonas Schöley